Real-time occupancy signage creating safety in numbers
COMPANY
Density.io
DURATION
3 Bi-Weekly Sprints
ROLE
Lead Product Designer
OVERVIEW
The world shut down in March 2020. The hard part was figuring out how to reopen it
Safe Display was my bet, not a top-down product initiative
When COVID shut down offices globally, Density's sensor network kept running. Real-time occupancy data for every indoor space, bathrooms, break rooms, conference rooms, dining halls, was already flowing. The question was whether that data could do more than optimize real estate portfolios. I believed it could.
In March 2020, Density was chasing supermarket chains that needed social distancing technology. The company's infrared sensors had a known limitation in retail environments with glass entries, so the team was building a mobile counter application for staff to track ingress and egress by hand. Working on the companion physical screens for that effort, I asked a redirecting question. Why aren't we applying this occupancy data to any indoor space, not just supermarkets?
I pitched the concept with Ben Redfield. Andrew Farah, our CEO, funded it within days. Safe Display became the product that made occupancy visible to the people who needed it most: the ones walking through the door.
Density had the data. Nobody was seeing it
The Challenge
COVID-19 didn't just clear buildings. It changed the social contract around shared space. Capacity limits became law. Physical distancing became policy. And every organization, from Fortune 500 companies to university dining halls to hospital waiting rooms, had to enforce standards they had never had to think about before. The tools didn't exist. The playbook didn't exist. And the stakes, employee safety, public health, legal liability, were about as high as they get.
What made the reopening problem harder was the behavior it produced. With no centralized, trusted source of safety information, people defaulted to self-governance. Some wore masks. Others ignored social distancing altogether. Some refused to enter break rooms at all. Others packed conference rooms as if nothing had changed. The result was a fractured, unpredictable compliance environment that frustrated facilities managers and created inconsistent safety experiences for the people actually occupying those spaces.
Where existing solutions fell short
No occupant visibility: Facilities managers had dashboards. The people walking through those spaces had nothing.
Enforcement without tools: Governments mandated reduced occupancy. Standard mechanisms to enforce it at scale did not exist.
Privacy blocked cameras: Camera-based systems were disqualified in bathrooms, locker rooms, and clinical environments.
No universal solution: Nothing served a single bathroom and a university campus from the same interface.

SOLUTION
Spatial awareness, not enforcement
The Solution
The instinct after COVID was to build compliance tools. Locks, gates, enforcers. We went the other direction entirely. The problem wasn't that people were incapable of making safe decisions. The problem was that they lacked reliable information to make those decisions with. Some were wearing masks. Others weren't. Some were avoiding break rooms out of caution. Others were ignoring posted limits entirely. The common thread was that nobody had access to real-time occupancy data at the moment they needed it.
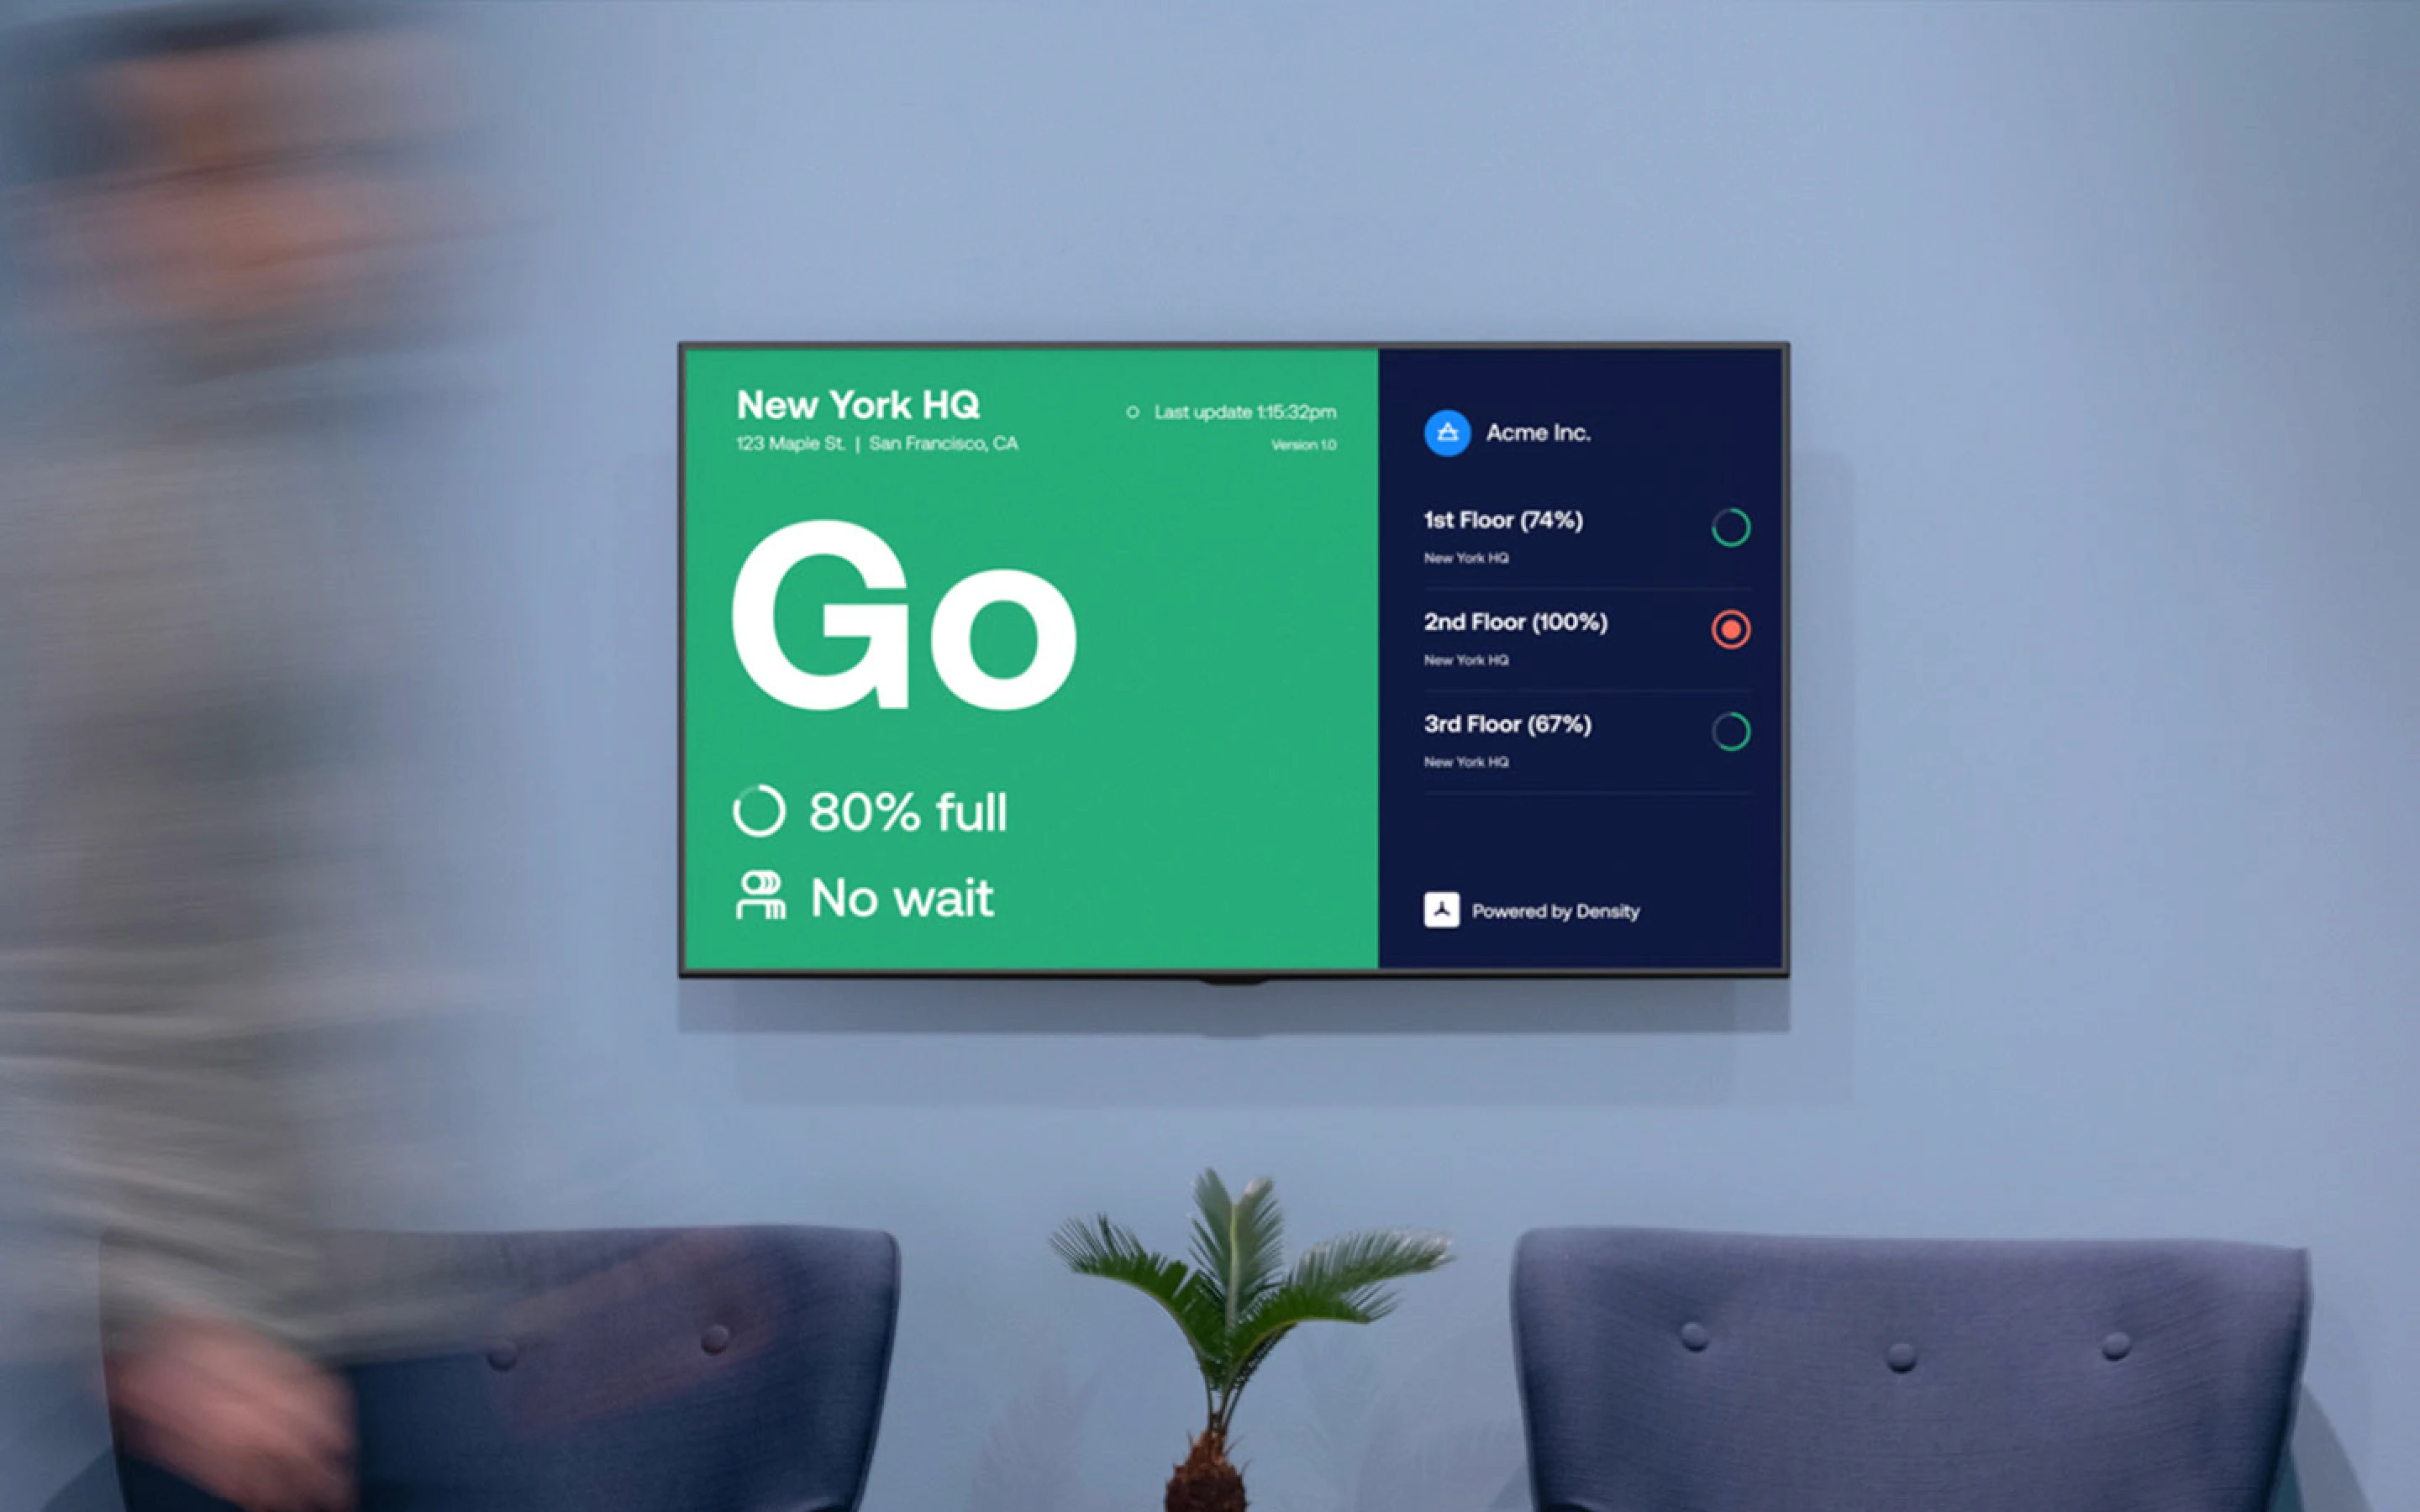
Safe Display was built around a single insight. When you give people accurate, real-time information about a space, they govern themselves. That framing drove every design decision in the product.
Core principles
Anticipate and inform the user's journey: Display occupancy before they reach the doorway, not after.
Deliver reliable real-time metrics: No estimated counts, no delays. Density sensor data has sub-second latency from sensor to display.
Surface actionable insights in context: The Go/Wait binary is the product. One glance, one decision, no interpretation required.
Bridge physical and digital signage: Compliance and wayfinding converge at the doorway. The display had to keep people safe and help them navigate at the same time.

RESEARCH
Three years designing for the manager. Zero for the person walking through the door
A net-new user archetype
Density had spent three years designing for enterprise facilities managers and portfolio owners. Safe Display forced the team to reckon with a user we had never formally designed for: the occupant. The person entering the space, not the person managing it. That shift reshaped the discovery work. Every persona, every research question, every screen had to hold two audiences at once.
Who we designed for
Occupants: The net-new archetype. Students, employees, patients, customers. Two seconds at the doorway, one decision, keep moving.
Campus Dining Operations leads: Managing peak-hour surges and student populations checking capacity before crossing campus.
Facilities managers: The existing Density user. Configuring displays across portfolios and enforcing capacity policy without adding headcount.
Healthcare and clinical operators: Strict regulatory caps, privacy requirements that disqualified any visual monitoring system.
Seeking validation
The first screen concepts were outward-facing retail signage, an attempt to keep the supermarket opportunity alive without depending on sensor accuracy at glass entries. We stress-tested the same design system across two contexts before committing: outward-facing retail (3rd Street Cafe) and indoor environments (3rd Floor Break Room). Both carried the same hypothesis. Only one could carry the product.
The Estimated Wait Time analysis was the pivot moment. In working through how wait time would actually be computed, the data showed the display concept worked significantly better indoors than at retail storefronts. The math itself was the evidence. We pivoted from outward-facing to indoor displays and committed to that direction for the rest of the project.
Research activities
Occupant behavior observation: Three building types covered: corporate, university, healthcare.
Facilities manager interviews: Enforcement pain points and compliance gaps, straight from the people carrying the policy.
Competitive audit: Existing occupancy signage and compliance tools across the market.
Sensor data analysis: Mapping peak occupancy patterns to space type, the input that validated the pivot.
ANALYSIS
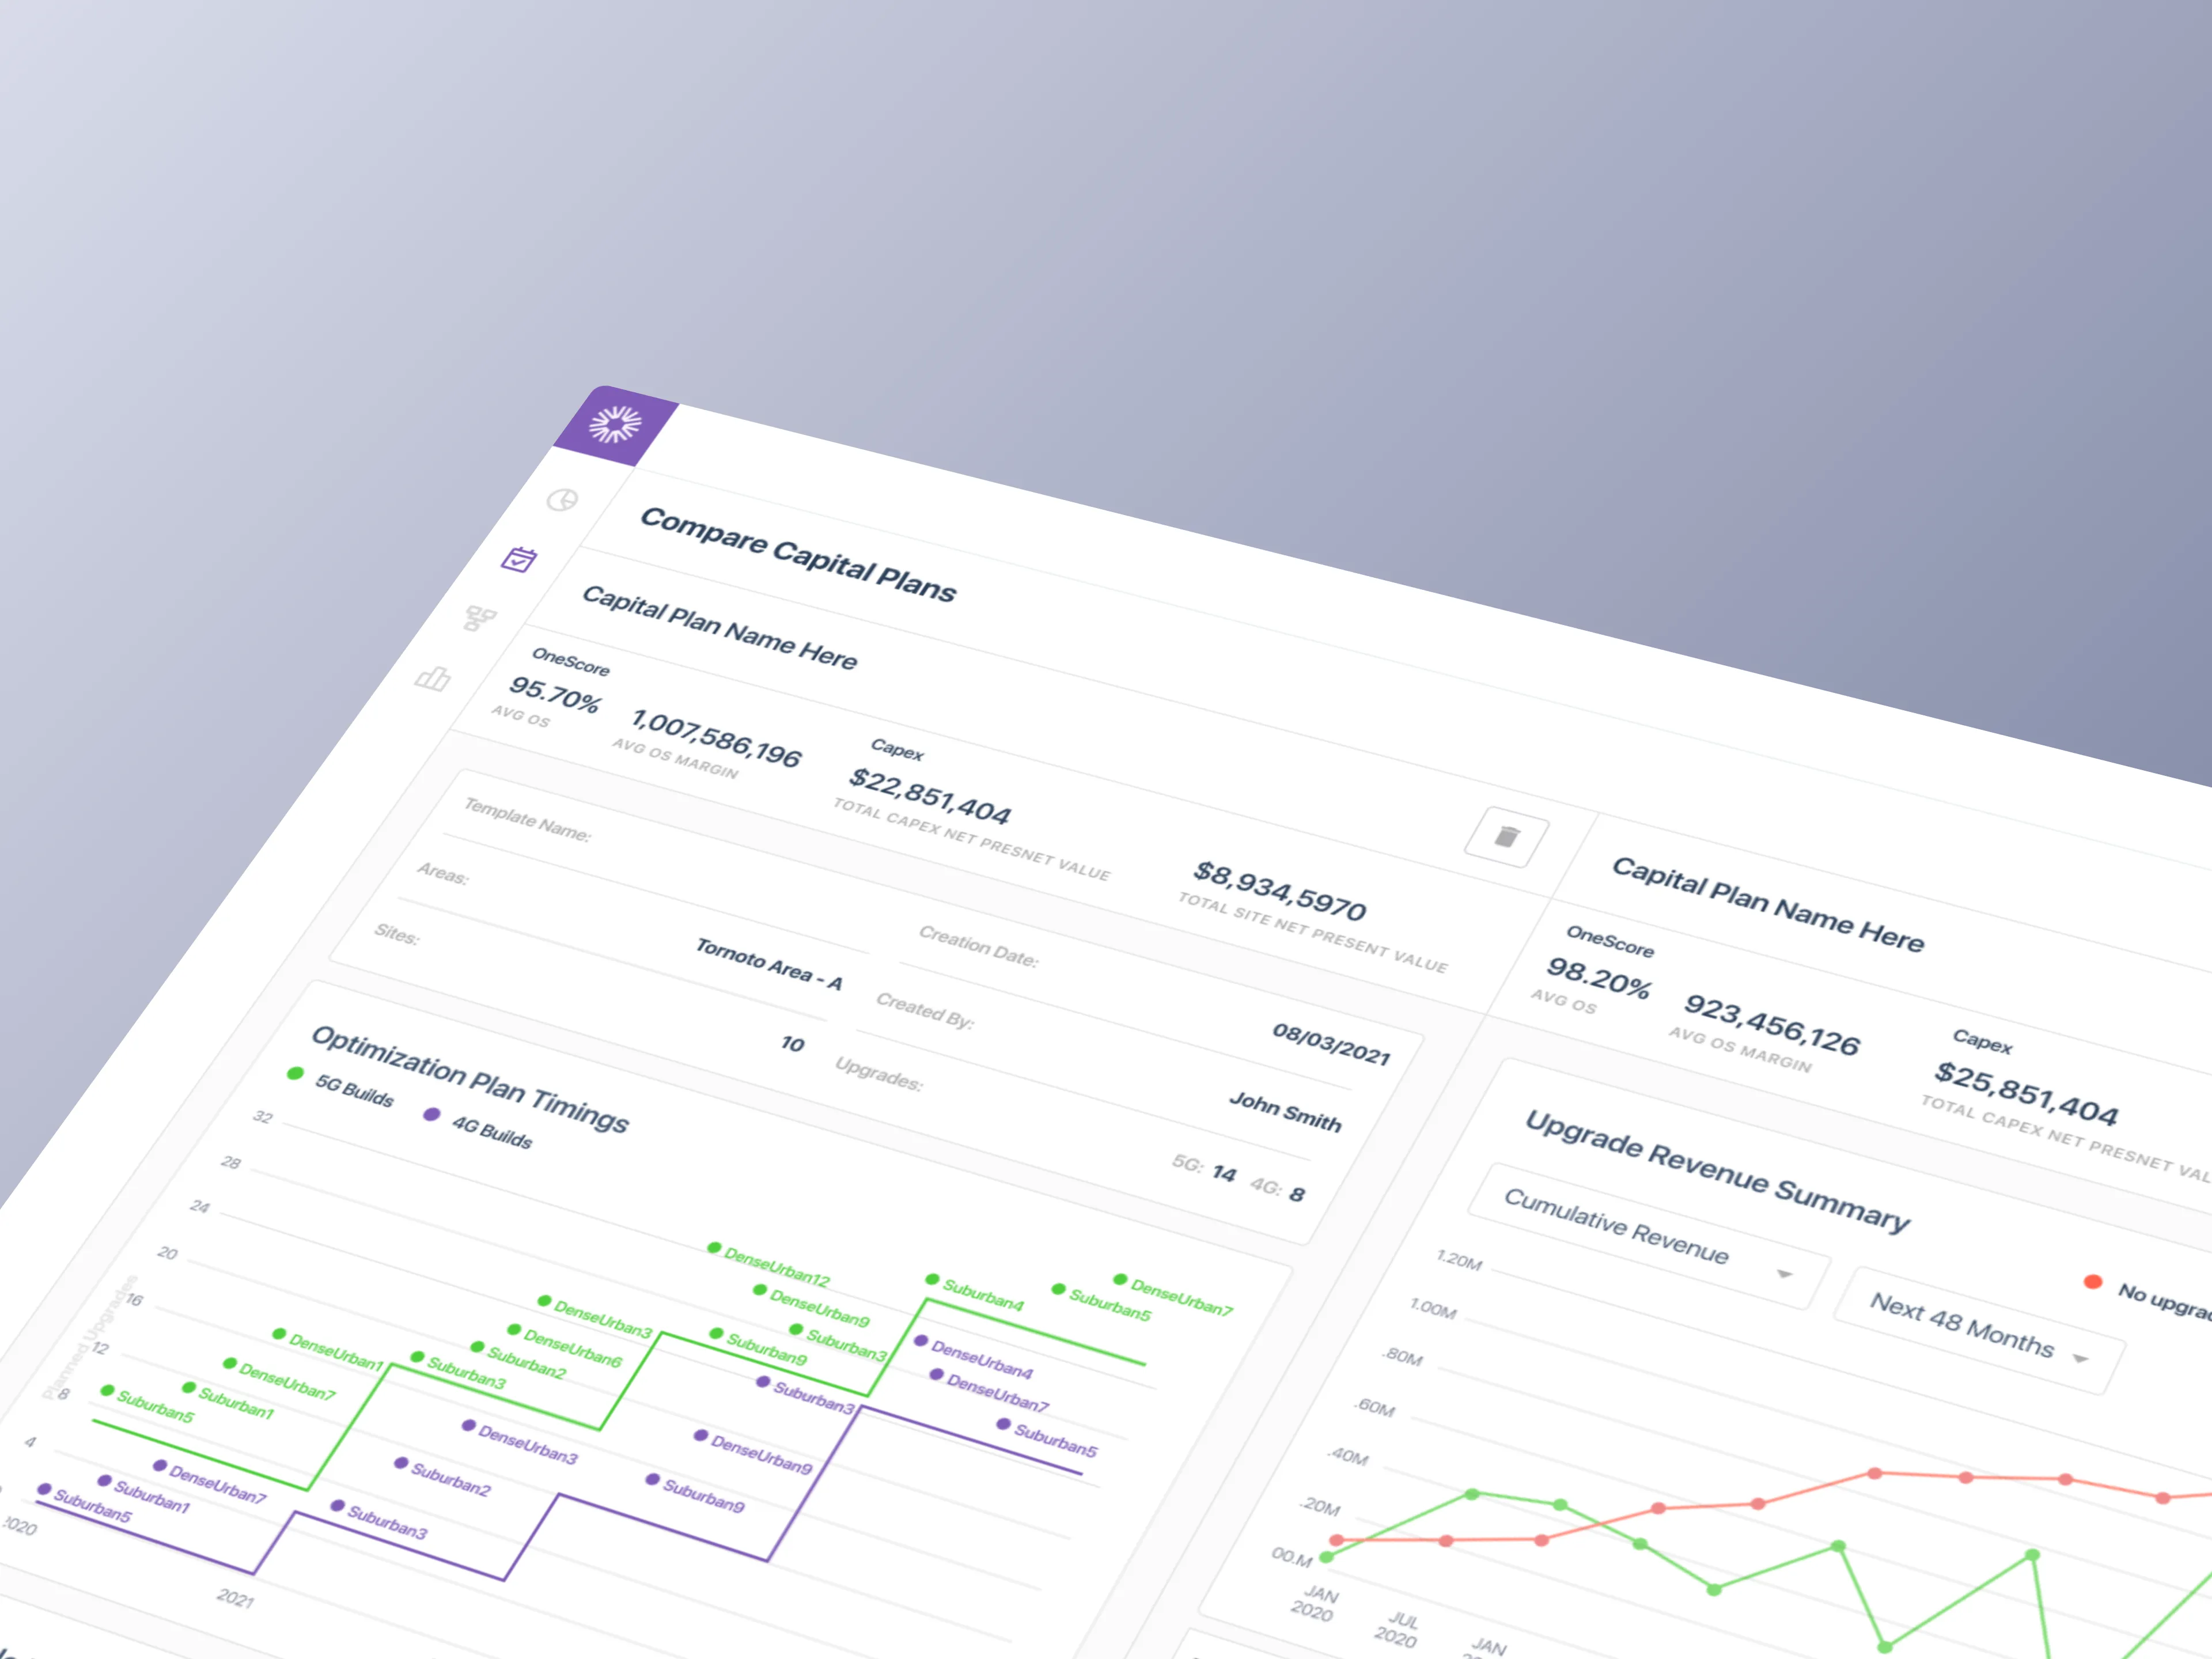
Before a single screen was designed, we mapped every decision a facilities manager would need to make
Double duty
The CMS didn't exist. We mapped every branch of the configuration flow before touching Figma: Display List, Display Type, Device Type, Space Selection, Conditional Options, Manage. Underlying every direction explored was a core design tension. Physical signage tells you what you must do. Digital signage can tell you what you might want to know. Safe Display had to hold both: the authority of compliance signage and the utility of an information system.
Four directions explored
Full screen: Single space, maximum clarity.
Directory: Multi-space, built for lobbies and main entrances.
White labeling: Customer brand over Density brand where the context demanded it.
Conditional metrics: Surface different data based on space type and use.
How might we
01. Communicate real-time occupancy to someone who has two seconds and somewhere to be?
02. Design one tool that works equally well in a bathroom, a break room, a lobby, and a university dining hall?
03. Make it easy to configure, deploy, and manage without an IT team or a design background?


ITERATIONS
One URL. Any screen. Any space
Click here, there, done
The founding principle became the product constraint. Generate a URL, open it on any browser-enabled device, and it surfaces live occupancy data for the configured space. No app store. No SDK. No documentation. Safe Display was designed as a feature of the Density platform, not a standalone product. That framing changed everything about how we scoped the CMS.
The CMS functionality was net-new, but the design patterns were reused from Density's existing Space Configuration module. Facilities managers configuring a Safe Display would recognize the configuration flow from elsewhere in the product. We didn't have to invent new UI conventions for form layouts, configuration flows, or list and detail views. The patterns were the shortcut. The CMS itself was net-new work.
What shipped in Round 1
Hardware agnostic deployment: Tablet and TV at multiple resolutions and manufacturers, landscape or portrait. Users did not have to think about hardware.
Multi-scale configuration: Single space, multi-floor office, or full campus. Same interface, same mental model.
One URL, hundreds of displays: A single customer could deploy across an entire portfolio in an afternoon.
Live preview pane: Real-time render of what was being configured, to prevent misconfiguration before pushing to hardware.
Privacy by design: Infrared sensing inherited from Density's platform. No cameras, no images, deployable in bathrooms and clinical spaces.


8.2K
Students needed to understand occupancy across campus in order to stay safe
10K+
Employees returned to multi-floor offices and saw directories showing essential data
25+
Treatment rooms and storefronts with strict caps on capacity and occupancy
FINAL DESIGNS
We launched. Then we went into the field. No directives, just directories
From feature request to shipped mobile experience, in two weeks
After Round 1 launched, I worked with Customer Success to run surveys and user tests in the field. Four design partnerships formed: University of Notre Dame in higher education, Verizon in enterprise, and smaller retail chains in healthcare and in beauty and wellness. The goal was to understand which features mattered most across categories and real estate footprints.
Notre Dame drove the most urgent request. Students returning for summer sessions and fall term were being held back by parents afraid of COVID exposure. Parents needed visibility into campus space occupancy before they'd let students go back. Notre Dame's IT team, Paul Turner, Steven Weaver, and student developer Daniella Galvão, asked us to build a mobile application showing students how occupied different spaces on campus were.
We didn't build a native app. We leaned harder into the founding "one-click" principle. The URL was already the product. Mobile was just another device pointing at it. A QR code on the display, scanned by any student or occupant, opens the same URL in a mobile browser rendered as a directory view of adjacent spaces. No app store submission, no OS fragmentation, no version management. From design partner feedback to shipped product: two weeks.
What changed in the CMS
Display Type as first-class property: Single Space vs Space Directory, selectable at creation and visible in the display list view.
Display Branding as a filter dimension: White-labeling elevated from feature to organizational axis in the CMS header.
QR generation controls: Show QR Code checkbox plus a QR Code Link dropdown that routes scanners to a mobile-optimized directory view.
Per-space thresholds: Each space inside a multi-space directory could carry its own Safe Capacity target.
Directory as a family of expressions: Status-indicator list, capacity-by-floor, sparkline trend, horizontal bar chart. All configurable from the same CMS surface.


IMPACT DELIVERED
From feature request to mobile. Two weeks, start to finish
Safe Display launched in under three weeks and ran for six months before being sunsetted when Density shifted focus to its Series D raise
In that window, it reached nearly every customer in Density's portfolio, reduced occupancy violations across client sites, and contributed to the platform narrative that helped close a $125MM round at a $1.05B valuation. For a product that wasn't supposed to put Density in the digital signage business, it did a great deal of work. The product born from COVID became a casualty of the company moving past COVID.
What the data showed
No training required: Occupants acted on the display without instruction, signage literacy, or prior experience.
Violations declined: Capacity limits held across client sites without guards, gates, or enforcement staff.
Universal signal: ADA 508 compliant red/green system that crossed language barriers and worked at a glance.
Privacy by design: Infrared depth sensors captured no images and no video. Safe Display was deployable in bathrooms, locker rooms, and clinical settings where camera-based systems were non-starters.
Self-governance at scale: The central bet paid off. When people had real-time occupancy data at the point of entry, they self-regulated without enforcement, guards, or gates.